Pancakes or waffles? Beach or mountains? iPhone or Android? People have preferences and our technology is no different. Whether you have specific reasons for your choice or it is a simple matter of sticking to what you know, many of us have our favorites, and we are loyal to them.
One area that has a bold line of demarcation is smartphones. While it is not uncommon for people to swap from one brand to another and back again, most times we find what we like and stick to it. For some, we are so loyal in fact that we try to convince others to join our not-so-exclusive club. Perhaps that is why some iPhone users find themselves sighing every time they receive a green text message from their friend who refuses to switch their allegiances.
At Secure Data Recovery, we know that you have many options for smartphones, but at the end of the day iOS and Android are undoubtedly the leaders in the U.S. Over the years, we have seen many opinions online about the differences in operating systems and the frustrations people have when messaging others with a different phone.
So we decided to survey Americans to learn where these frustrations are most prevalent and what annoyances top their list. For each frustration respondents admitted to and their frequency of irritation, we awarded points to create a frustration score on a scale of 0 to 100, with 100 representing the most frustrated. Read on to learn more about our findings.
Key Takeaways
- Low quality videos and photos are the most common phone differences that frustrates Americans.
- Mississippi and California residents are most likely to feel frustrated by differences in iOS and Android phones.
- Maine and Kansas residents are least likely to feel frustrated by differences in iOS and Android phones.
- Nearly 1 in 2 Americans with Androids say they have been shamed for their phone.
- Nearly 1 in 2 iPhone users say they have teased people with an Android.
- 1 in 2 iPhone users admit they think some Androids are just as good as iPhones, but don't want green text bubbles.
The Differences That Annoy Us Most
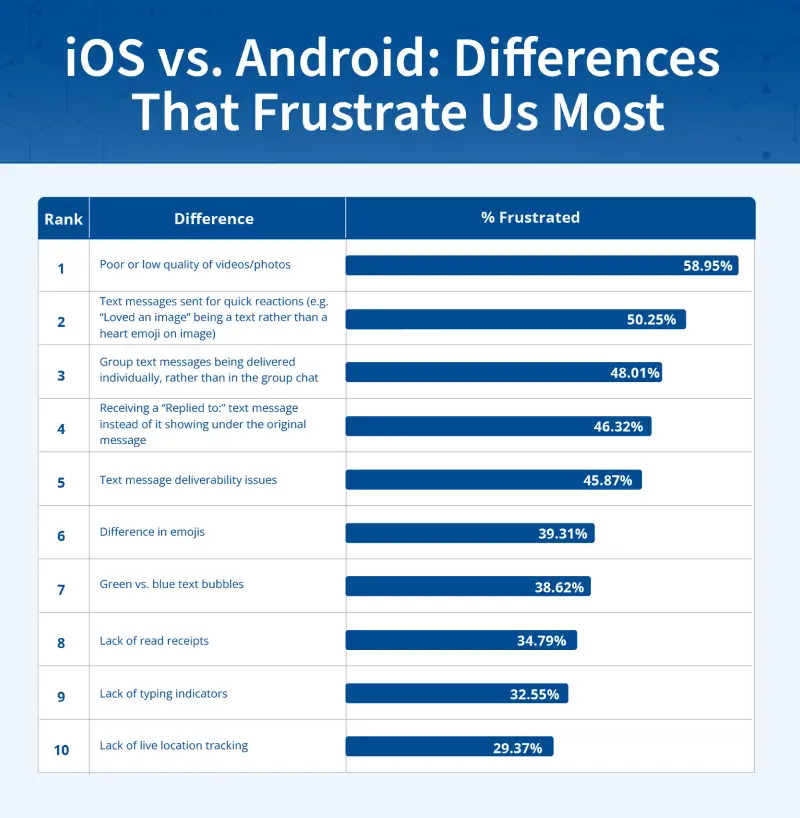
If you have ever messaged someone with a different phone than you, you have probably encountered some frustrations. Whether you dislike the group chat text bubbles changing to green when an Android user enters or the difference in emojis, you are not alone.
Leading the way for the most common frustration among Americans is the low quality of videos and photos when shared between iOS and Android, which nearly 3 in 5 people complain about. In second place is a difference in texting that has 1 in 2 Americans irritated. In 2016, Apple introduced quick reactions in text messages, allowing users to choose from six reactions to respond to texts with. This feature has since been updated to allow any emoji to be used for reactions, but you can face difficulties when using this option while texting someone with a different operating system.
In third place is an irritation with group text messages being delivered individually, rather than in the group chat. Similarly, receiving a “Replied to:” text message instead of it showing under the original message is the fourth most common frustration among Americans.
While a third of people are only rarely irritated by these differences, 1 in 7 are frequently bothered by them. In fact, more than two-fifths of Americans use messaging apps like WhatsApp to avoid difficulty texting those with other operating systems. Additionally, nearly a third of people have avoided starting a group text with someone with a different type of phone due to these issues.
Where Americans Are Most Frustrated
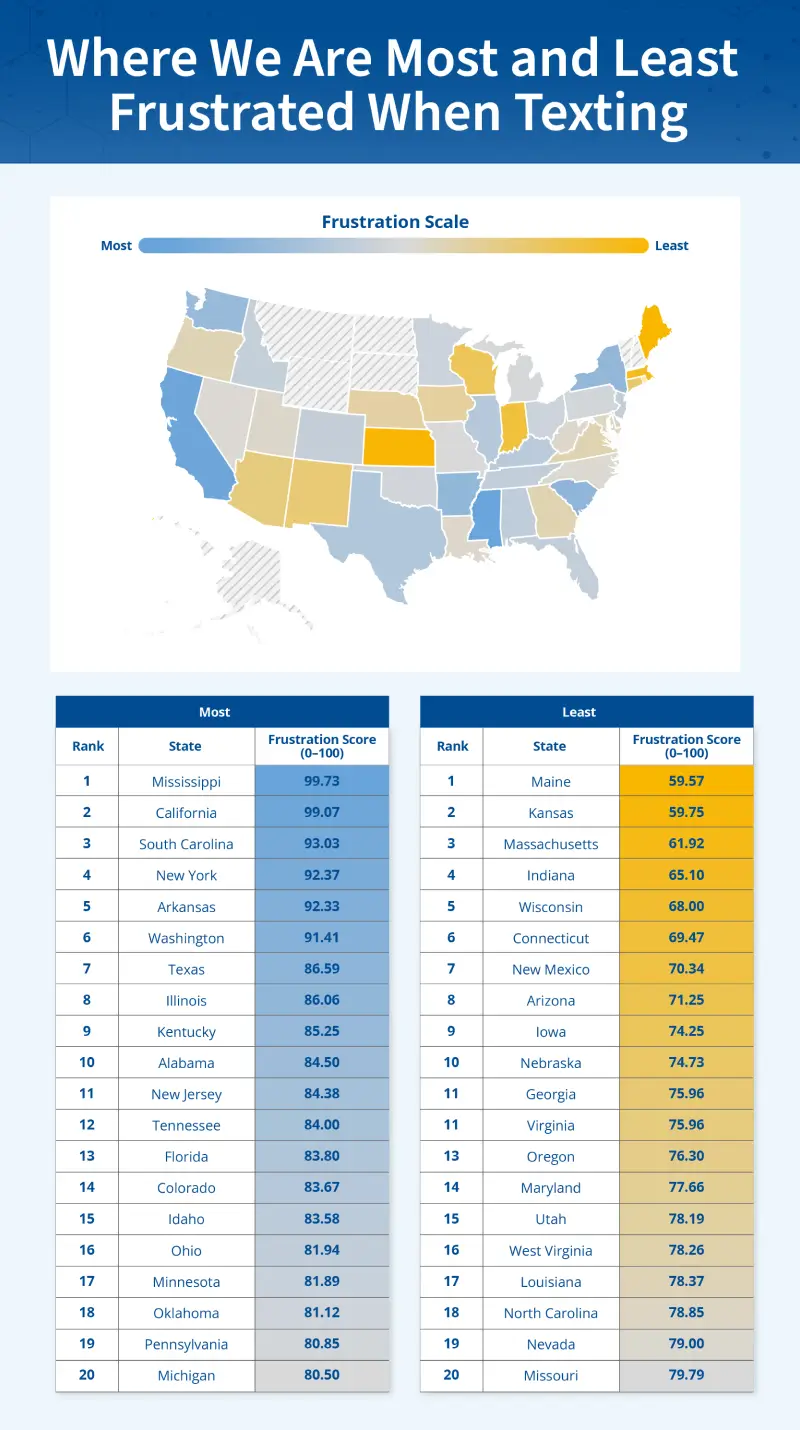
With all of these frustrations in mind, we wanted to turn our attention to where people are experiencing them most. Leading the way is Mississippi with a frustration score of 99.73 out of 100. These frustrations have even led 67% of residents to use messaging apps to avoid issues when texting people with a different operating system.
California is up next with a score of 99.07 out of 100, as residents are most likely to be frequently irritated by the differences. South Carolina claims third as residents of the state are the most likely to be frustrated by the lack of read receipts.
On the other hand, Maine residents are the least likely to feel frustrated by iOS and Android differences. In fact, nearly 1 in 4 residents say they are never irritated by them. Kansas is second on the list for least frustrated, followed by Massachusetts in third.
These differences have led to Android users even receiving criticism for the phone they use as nearly 1 in 2 say they have been shamed for their phone. While 49% of iPhone users admit to this shaming, 1 in 2 admit they think some Androids are just as good as iPhones, but they don’t want green text bubbles.
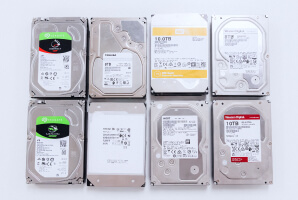
Keep Your Phone’s Data Safe with Secure Data Recovery
Whether you have an iPhone or an Android, it is important to make sure you are keeping your data secure. At Secure Data Recovery, we know that technology is an important part of our lives, regardless of the specific brands we choose. That’s why we offer iPhone and Android data recovery along with a variety of other services to help you keep your information and files safe.
From hard drive recovery to other data recovery services, our team of experts have a 96% success rate in retrieving data from damaged or defective storage. And with our no data, no recovery fee guarantee, you don’t have to worry about paying for recovery that doesn’t work. Get started today by requesting a free quote so we can help solve your data loss.
Methodology
In this study, we set out to learn where Americans experience the most frustrations while texting people with a different phone. To do this, we surveyed Americans in each state and first asked if they had an iPhone or Android. From there, we asked questions about their experience with that phone, what differences between iOS and Android annoy them, and how frequently they encounter these frustrations.
We then awarded a point for each annoyance selected, along with points based on how often they are frustrated by the differences, if they have turned to other messaging apps to avoid issues, and if they have steered clear of group messages with people who use different phones. We then calculated the average score by person and then by state. Finally, we adjusted those scores on a scale of 0 to 100, with 100 representing the most frustrated.

Scott McMacken

With extensive experience and a passion for data recovery, Scott enjoys sharing his knowledge and helping others understand the intricacies of data recovery, encryption and loss prevention.